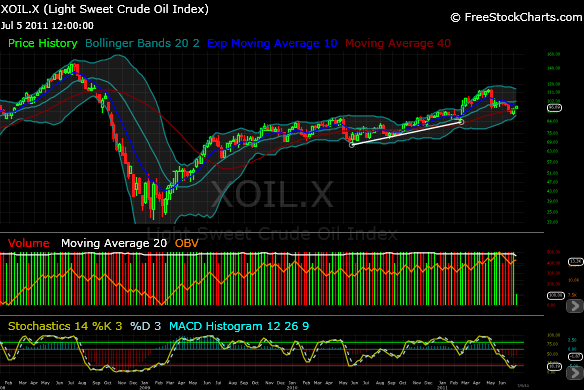
In spite of the SPR release, the weekly chart of oil shows that the uptrend is still intact. The contraction of the Bollinger Bands suggests a period of increased volatility in the near future (2 to 3 weeks). The Stochastic cross over from an oversold level indicates that the next period of volatility expansion has a high probability of being to the upside, as the closing prices on a weekly basis are starting to occur at the top of the price range over the last 14 days (prices are starting to gain upside momentum on a weekly basis).
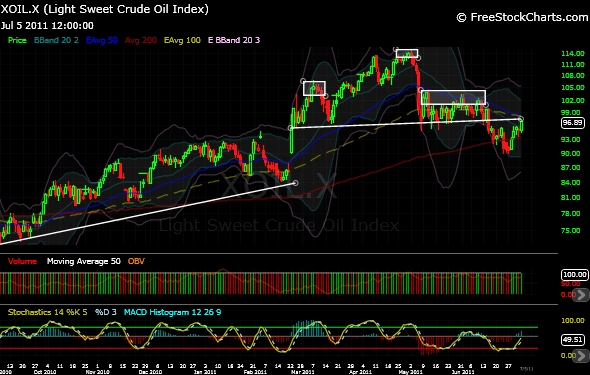
So we can make a reasonable assertion that the price of oil is most likely up for the next month or so. Let’s analyze the daily chart- we will see a different picture. We’ve got a clear Head & Shoulders pattern that is just about as text book as you can get in real life. Well, almost text book. This is more of a Quasimodo H&S pattern as the right shoulder is a bit of a complex, elongated shoulder. But nonetheless, we have all the stages of an H&S top on the daily: an uptrend to reverse, a breakout and peak to form the neckline and left shoulder, a higher high to form the head, a lower high to form the right shoulder and a breakdown below the neckline. We’ve even got the often overlooked throwback to test the breakdown. This is where we currently are. H&Ss aren’t theoretically valid until that throwback fails at the neck line. This is what happened during the dreaded H&S in the S&P last year before Bernanke’s Jackson Hole meeting. The throwback broke above the neckline and invalidated the rough H&S pattern. Traders were still carping about the prognostication of future growth (or lack there of) that the H&S pattern was providing us even after the throw back broke above the neckline. These faux technicians missed a big chunk of the up move if they were still focused on the H&S even after it was invalidated. I think the same thing can happen here with oil. If it’s going to break down, it will happen this week. We are right at the neck line on a daily chart. Given the strength of the weekly chart, I’d suspect that the daily chart has less forecasting ability as to the direction of price. But if I’m wrong, I’ll know by Monday, July 11, which happens to be the day that Alcoa (AA) reports…


Pingback: Today’s Assessment: High Levels of Caution and Cash Warranted | Palpara Merchants