Palpara Merchants

Substantive Finance

July 6, 2011
by Patrick
Comments Off on Sentiment

Sentiment

Reading the blogs and trading sites and watching CNBC Fast Money, one can infer that a growing number of traders are positioned too much in cash (aren’t we all when the market is moving up?) and are frustrated that we don’t get a pull back. Maybe I’m too young and too new to trading, but it’s been my experience since I started (around the time of the fall of Bear Sterns) that this market has a a riding lawn mower transmission- tortoise, hare, reverse. We just don’t get any ups and downs in short time frames that suit most human beings. We don’t get logical moves up, followed by logical moves down in the time frames that suit most people. We trickle up, rip higher, or go down without a pause, until we go the other direction. There have been exactly 3 buyable pullbacks since the March 2009 bottom. Nearly all the time has been passed by riding the upper Bollinger Band on the S&P.

You could hear a trader on Fast Money last night that was obviously under invested (again, like most of us) and lamenting about the oversold nature and how due for a pull back the market is. Today on the half time report, he called the close with two words: “Buy more” as if he had been buying for the past week. If this trader were intellectually honest, he would have said “Start buying small if you’re under invested” but trading is like trout fishing. The fish are always bigger when you’re telling your friends about catching them.

That is why the market will probably continue to move higher. Too much cash is anxious to get in. This is probably just market participant cash driving the market higher. Another round of retail cash hasn’t hit yet. I remember last year around the same time, when the Bush tax cuts were passed, a round of retail cash came it. You could see it from increased membership to trading newsletter sites and anecdotally from non-market followers putting extra cash into stocks. I have no idea what it was, but the relentless climb after the BP Macondo/ Deepwater Horizon fiasco was resolved and before the tax cut passing got a boost from new money flowing in. I’ll bet the same thing happens this year. The only way to keep up with this market short term, and beat it long term, is what I call the barbell strategy: torrid growth momentum on one end, nothing but cash in the middle, and slow growth, high yielding MLP, REITS, and telcos on the other end. Here’s an example: CRM, CMG, ISRG, NFLX, CRR, and LULU on one end (while these are all high growth names, it is a diversified group), 25%-33% cash, and NLY, KMP, and WIN (again, a diversified group) on the other end. This strategy excel in this straight up, straight down environment.

July 6, 2011
by Patrick
2 Comments

Oil: In Depth Technical Analysis

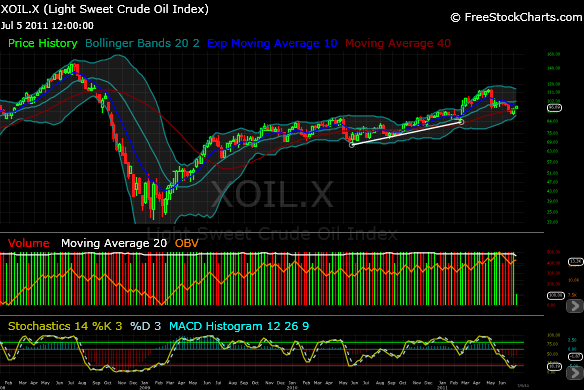
In spite of the SPR release, the weekly chart of oil shows that the uptrend is still intact. The contraction of the Bollinger Bands suggests a period of increased volatility in the near future (2 to 3 weeks). The Stochastic cross over from an oversold level indicates that the next period of volatility expansion has a high probability of being to the upside, as the closing prices on a weekly basis are starting to occur at the top of the price range over the last 14 days (prices are starting to gain upside momentum on a weekly basis).


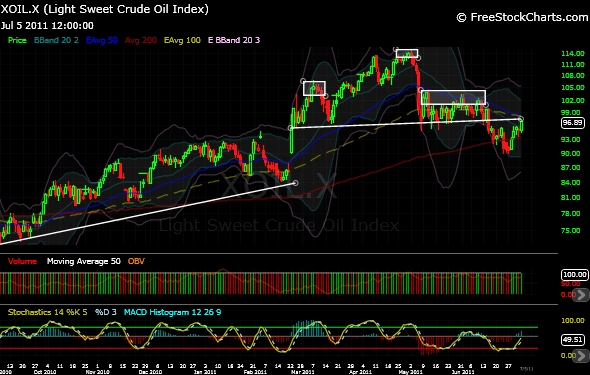
So we can make a reasonable assertion that the price of oil is most likely up for the next month or so. Let’s analyze the daily chart- we will see a different picture. We’ve got a clear Head & Shoulders pattern that is just about as text book as you can get in real life. Well, almost text book. This is more of a Quasimodo H&S pattern as the right shoulder is a bit of a complex, elongated shoulder. But nonetheless, we have all the stages of an H&S top on the daily: an uptrend to reverse, a breakout and peak to form the neckline and left shoulder, a higher high to form the head, a lower high to form the right shoulder and a breakdown below the neckline. We’ve even got the often overlooked throwback to test the breakdown. This is where we currently are. H&Ss aren’t theoretically valid until that throwback fails at the neck line. This is what happened during the dreaded H&S in the S&P last year before Bernanke’s Jackson Hole meeting. The throwback broke above the neckline and invalidated the rough H&S pattern. Traders were still carping about the prognostication of future growth (or lack there of) that the H&S pattern was providing us even after the throw back broke above the neckline. These faux technicians missed a big chunk of the up move if they were still focused on the H&S even after it was invalidated. I think the same thing can happen here with oil. If it’s going to break down, it will happen this week. We are right at the neck line on a daily chart. Given the strength of the weekly chart, I’d suspect that the daily chart has less forecasting ability as to the direction of price. But if I’m wrong, I’ll know by Monday, July 11, which happens to be the day that Alcoa (AA) reports…


July 1, 2011
by Patrick
Comments Off on All Systems Go

All Systems Go

We’ve got the KBW bank index, the SOX, and the DJT-20 all breaking out, with transports leading the way to new highs. It’s hard not to be bullish with all indicators of a healthy market flashing green. I guess that was the pause that refreshes. Shame on anyone who thought the 200dma wouldn’t hold, like the 200dma of so many industrials (that are now completely disregarding their 200dma as they blow past it) like CAT, DE, and CMI. Here comes another V-shaped, low volume bounce.

Still, some cautious part of me, that has kept most of my portfolio safely in cash and out of the massive 5 day rally, sees some resistance at 420 on the SOX, which I think is more important than the KBW Bank index, which may go to 55 before it sees any major selling pressure. The transports are in blue sky territory. So we’ve got 2 out 3 that are sustainable.

If you’re not fully invested, as I’m sure most market participants aren’t, you can’t really be enjoying these past 5 days as much as someone that observes and doesn’t play. This market dishes out misery on the down days, and if you’re cautious, you won’t be enjoying the up days cause you’re not making as much money as the averages. My barbell strategy doesn’t allow me to fully participate in the excitement on days like the past week. But my portfolio, while underperforming the S&P this week, is still reaching new all time highs. I plan to keep it there.

July 1, 2011
by Patrick
Comments Off on Fireworks or a Dud?

Fireworks or a Dud?

On this day, July 1, of last year, 2010, the S&P made what is now the 52 week low. We rallied after that for exactly one year, with only three pullbacks. This demonstrates the markets tendency in the past two years to remain sticky to the upside. The market breaks an obvious support level, then rallies to new highs and keeps on going. This is the pattern that we’ve seen since March 2009. I don’t expect this time to be any different. I’m not looking for any pullbacks to buy. The only way to get in is to buy small and hope for the pullback that never comes. I’m sticking with my bar-bell approach and buying torrid growth stocks and defensives, but not buying anything in between so high cash levels can be maintained. Unfortunately, this may not be the best way to out perform the market. But it’s really not trending right now so out performance may be difficult for most traders, as big gains disappear if you hold one day too many. If you’re dealing with smaller portfolios under $500,00. There is just no way to outperform with this strategy in the short term. But this strategy will outperform in a longer time frame of 1-2 years if the market remains in this character of straight up, straight down, with the primary trend pointing up. Today will be 5 days in a row of around 100 point gains on the Dow. Too many traders have too much cash on the sidelines to act as fuel to this fire. This 4th of July will probably turn out like last year, with one more buyable pullback before another move straight up, blowing past any resistance points more than a week old. That seems to be the markets attention span these days. We have to throw out last weeks’ support and resistance lines and form new ones every few days with candle stick analysis, not trend-line analysis. I doubt this is new money coming into the market- it’s just cash that traders have from selling stocks as they broke down last week. Now we are putting that cash back to work on the same stocks that were breaking down, now at higher prices as they are breaking out or have already broken out. This market loves short term fixes.

June 30, 2011
by Patrick
Comments Off on The Tsunami Warning

The Tsunami Warning

Sitting on the beach, you can see 12 miles to the horizon. Life guards, like traders, must get a high vantage point to see all the activity possible. We are most concerned about the activity closest to shore, where the swimmers are. Traders too, are concerned about the next occurring data point- the next quarter, where the quick money is to be made. While we can see for 12 miles out, we generally don’t have to focus attention on that 12 miles. Life guards may spot the occasional shark fin out there and get everyone out of the water, and let them back in after a few minutes when the threat is out of sight. Traders may spot the proverbial shark fin of European contagion and sell stock. After some austerity measures are passed and the threat is out of sight, we will buy our stock back.

What we can’t see is the Tsunami building under the surface just passed the horizon. We won’t be prepared to get out of the way in time. Some will survive by getting on roof tops, but the stairwells will fill pretty quickly. Some won’t make it. This is what happened in the Indian Ocean in 2004 when the massive Sumatra-Andaman earthquake caused a tsunami that killed 230,000 people in 14 countries. Vacationers sunbathing had little time flee to safety. Despite a lag of up to several hours between the earthquake and the impact of the tsunami, nearly all of the victims were taken completely by surprise.

Similarly, the housing- bust induced global recession was the earthquake that caused the sovereign-debt tsunami that is building under the surface. It’s too far past the horizon, and the waves aren’t yet visible in the deep water. But we’ve already received the warning. We too will be victims taken completely by surprise. We have 2Q earnings reports coming out, and they should be good. Greek’s debt and all the European banks that are loaded up with that debt shouldn’t have an effect on US companies’ earnings last quarter. Commodity prices have come down in the past month, and companies ranging rom Coke to AK Steel announced price increases and surcharges so their earnings should have substantial tailwinds. The 2Q reports are the activity closest to shore. This is where our attention will be focused, as it should be. The earnings of companies are always the underlying influences of their stock price over time. However, every so often (in recent times more frequently- keeping in line with George Soros’s theory of Reflexivity) outside shocks will affect the entire stock market and consequently, any company’s stock that trades in the market, no matter how well they are doing. A massive repricing of risk is the outside shock, the wave building under the surface, that we await.

Prognosticating the Apocalypse is a favorite past time of followers of the stock market. The End of Times is always right around the corner. “You stupid retail, momentum-crowd traders don’t know what you’ve gotten yourselves into” is the rallying cry of Elliot Wave technicians (the Nostradamuses of the stock market). It’s not helpful to inform someone of the trouble that looms ahead if there is money to be made now. So where’s what we do: avoid building positions in cyclicals (DE, CAT) but trade them if there is a technical set up- DE has formed a semblance of support and can be bought safely, while CAT has already broken out and is way to risky to be buying now. We want to buy utilities that have yield support- SO is my hometown favorite. My go-to name is NLY in the REIT space. It’s just had an ex-div pullback so it’s ok to buy. WIN is my other go- to dividend payer as it is much cheaper than VZ or T and should have more growth than most investors expect (at least the investors that sold it 2 quarters ago on the bad access line losses- which is way too short term thinking for this type of business model), and WIN can be bought here too. Also, I like the growth names- Cramer’s FADS CAN (FFIV, AMZN, DECK, CRM, CMG, AAPL, NFLX, and throw in ISRG, NTAP, and CRR) and writing covered calls against the common after a 7-10% move. You can tink of it as a bar-bell approach: torrid growth on one end, slow growth on the other end, and nothing in between. There are plenty of good companies that are selling for less than their growth rates with good charts (PETM comes to mind) but we just don’t have room for these stocks in our portfolio. These are the best ways to keep up with the market while maintaining high cash positions. We can worry about outperformance when the market is in an uptrend. Right now capital preservation trumps capital appreciation.

June 24, 2011
by Patrick
Comments Off on Open the spigots SPR

Open the spigots SPR

The US Strategic Petroleum Reserves will release 30M barrels of oil at base price of a little more than $112 (presumably, the barrels will be purchased by consumers of oil at prices lower than the base price). NATO has been “air striking” Libya since March. According to the CIA World Fact Book, Libya produces about 2M barrels/day of the world’s 89M barrels/day total production. Libya’s production accounts for about 2.5% of the world’s demand for oil. They produce a very high quality, light, sweet crude. Much of this Libyan oil goes to refiners in Italy that are set up to refine this specific type of crude.

I remain skeptical that the increase in the price of crude (WTI rose 10%-20% since the Libyan news broke out) was due to actual supply disruptions. The price of oil that we see quoted every day, is the futures contract for WTI (West Texas Intermediate). These futures markets are thin, computers and humans are the market participants, and generally, traders, not consumers of oil (the refiners, air liners, industrial co’s, etc.) control the day -to- day price movements (longer term, the consumers and producers should control the price if free markets work the way they are supposed to).

We, as a country, do NOT need to be depleting our emergency stocks of oil to get the price down at the pump before elections. We need to be encouraging increased domestic production of energy. The lower the price of oil, the less incentive there is for wildcat operations to get oil and gas out of the ground here in the United States. There are so many other ways to clear the weak hands out of the market- these are the traders that can buy futures contracts on margin. All the government needed to do was come into the open market, and blow out at-the-money strikes for the front and back month contracts with the SPR as collateral. We wouldn’t have had to sell any physical oil, and the cleansing of the market would have been quicker, and it could have been kept a secret.

The market is seeing through this short-sited ploy and trying to retest the lows from yesterday. Absolutely no follow through from yesterday’s afternoon rebound. Monday should be either a gap up, or a gap down. My bet is a gap down, but not with confidence, as the NYMEX 3-2-1 crack spread is breaking down today after a lower high made on 6-17-2011. This means lower gas prices at the pump, and that will be good for retail. It’s no man’s land out there- we’re not trending and we don’t know where the low is yet (the 200dma is holding so far, but isn’t that obvious? My guess is that it breaks on Monday). If you’re shorting, your a moron, because we’re more than 7% off the highs, and the odds don’t favor even more of a decline. If you’re buying heavily, you’re a moron because (get ready for irony) we’re only 7% off the highs, and who’s to say 10% or more isn’t in order after a double from the March 2009 low? And if you’re not buying or selling, then you’re just a spectator. Spectators are the guys that wish they were players. So we gotta do something. How about selling some calls against your remaining long positions if you have a hefty gain. I’m writing some covered calls against my CRM. I like the Jul 150 for $2. There’s a nice idea for a Friday in this miserable market.

June 23, 2011
by Patrick
Comments Off on Macro vs. Micro

Macro vs. Micro

As of Thursday, just after the Jobless Claims number came out, the futures are down 100. What happened yesterday? FDX, BBBY, and KMX say things are good and getting better. Didn’t DE and CAT just raised their dividends recently? Yea, I’m pretty sure they did. Does is matter to these cyclical companies’ stocks? Nope. Their stocks go down endlessly, but you feel like a moron if you sell as they break down, because on the first oversold bounce, they spike up almost to where you bought.

I think it’s safe to assume that everybody has an understanding that Greece cannot pay its debts and never will have the ability to repay in the foreseeable future (at least for the next 5 years let’s say). So the only option is for Germany and the IMF to assume their debts. Trichet would rather stick a needle in his eye than allow the seemingly best option for every country to be carried out: kick them out of the Zone. This seemingly obvious option would nullify the use of Greek bonds as collateral. As we learned from Bernanke’s speech yesterday after the FOMC rate decision, the European banks are loaded up with periphery (PIGS) exposure. And Bernanke told us that our banks are loaded up with European bank exposure. If Greece is allowed to default, the market will have to re-price a lot of risk very quickly. There’s lots of room for error if it’s forced to re-price quickly. The disaster scenario is easy to envision (make sure when you imagine how it will play out, you use the words “systemic” and “contagion” a lot in your vision).

So we have captains of industry telling us that things are getting better, and they are putting their money where their mouths are by increasing dividends and guidance. And we have the “contagion” disaster scenario that is has a good probability of happening but an unknown time frame (Germany will get sick of paying for Greece’s living high on the hog at some point, but there is a long road down which the can to be kicked). Either the market is way wrong in dumping their stocks, or the market is looking out to the horizon and seeing what the captains don’t- rough waters ahead.

We don’t have to pick who wins this macro vs. micro fight. We just have to shorten time frames, ditch the bull market strategies of building positions on the dips, and be willing to sell entire positions on the first sign of strength, keep the rest of our capital in high yielding utilities like SO and REITS like NLY, and trust that we’ll be around with our money in tact to play the next bull market, or the next leg of this bull market. But for now, we assume we are in a trading range or a downtrend until proven otherwise.

This is the hard part of trading, because trend-following technical analysis doesn’t work. You’ve got to be good and candle stick analysis a pick bottoms and tops with lose, but disciplined risk management stops (John Murphy’s Technical Analysis of the Financial Markets is a good place to start for brushing up on the Japanese interpretation of candles). You don’t want to give away your money to the computers, nor do you want to let the market do what it does best: confuse you to the point of inaction.

June 21, 2011
by Patrick
Comments Off on Twilight of the Open Outcry Market

Twilight of the Open Outcry Market

While standing in queue at the crowded farmers’ market for my usual Sunday bacon, I grew worried that for the second week in a row the bacon vendors would be out of my favorite bacon by the time I got to the front of the line. I contemplated how much that 1lb of back-fat was worth to me as their inventory was being reduced and sold to any one that left their house early enough to stand in line and the pay the $8 the bacon vendors were asking for each 1lb. I couldn’t imagine a more inefficient way for those bacon vendors to get rid of their inventory and for the buyers of bacon to purchase their product.

From the back of the queue, I shouted “8 and 1/4 bid for 1 bacon!” and waved my hands toward me repeatedly (indicating I was a buyer). The response: nil. So in the line I patiently remained and waited my turn to purchase my bacon. What a way to spend my time. Unfortunately for the pit traders in Chicago, the same ambivalent feelings towards an open outcry market are pervasive in the world of trading.

From FLOORED- a great depiction of how this market is going extinct in an 8 part series.

Part 1

Part 2

Part 3