All profitable traders have the ability to stick to a well crafted trade plan. A good trade plan starts with a good stock watchlist. What is the best stock screening software for making a watchlist? I like Ycharts but there are others.
Once you have been following your watchlist long enough to have identified key pivots in stocks that have evidence of institutional buying, you will need to drill down into technical analysis to focus on the highest probability trades.
Here are some examples of stocks with pivots that I identified last night and am watching for the next couple trading days for solid breakouts. Some stocks have higher probability for success, but let’s start with the lower probability stocks first, identify their flaws, and move up to the highest probability trades.
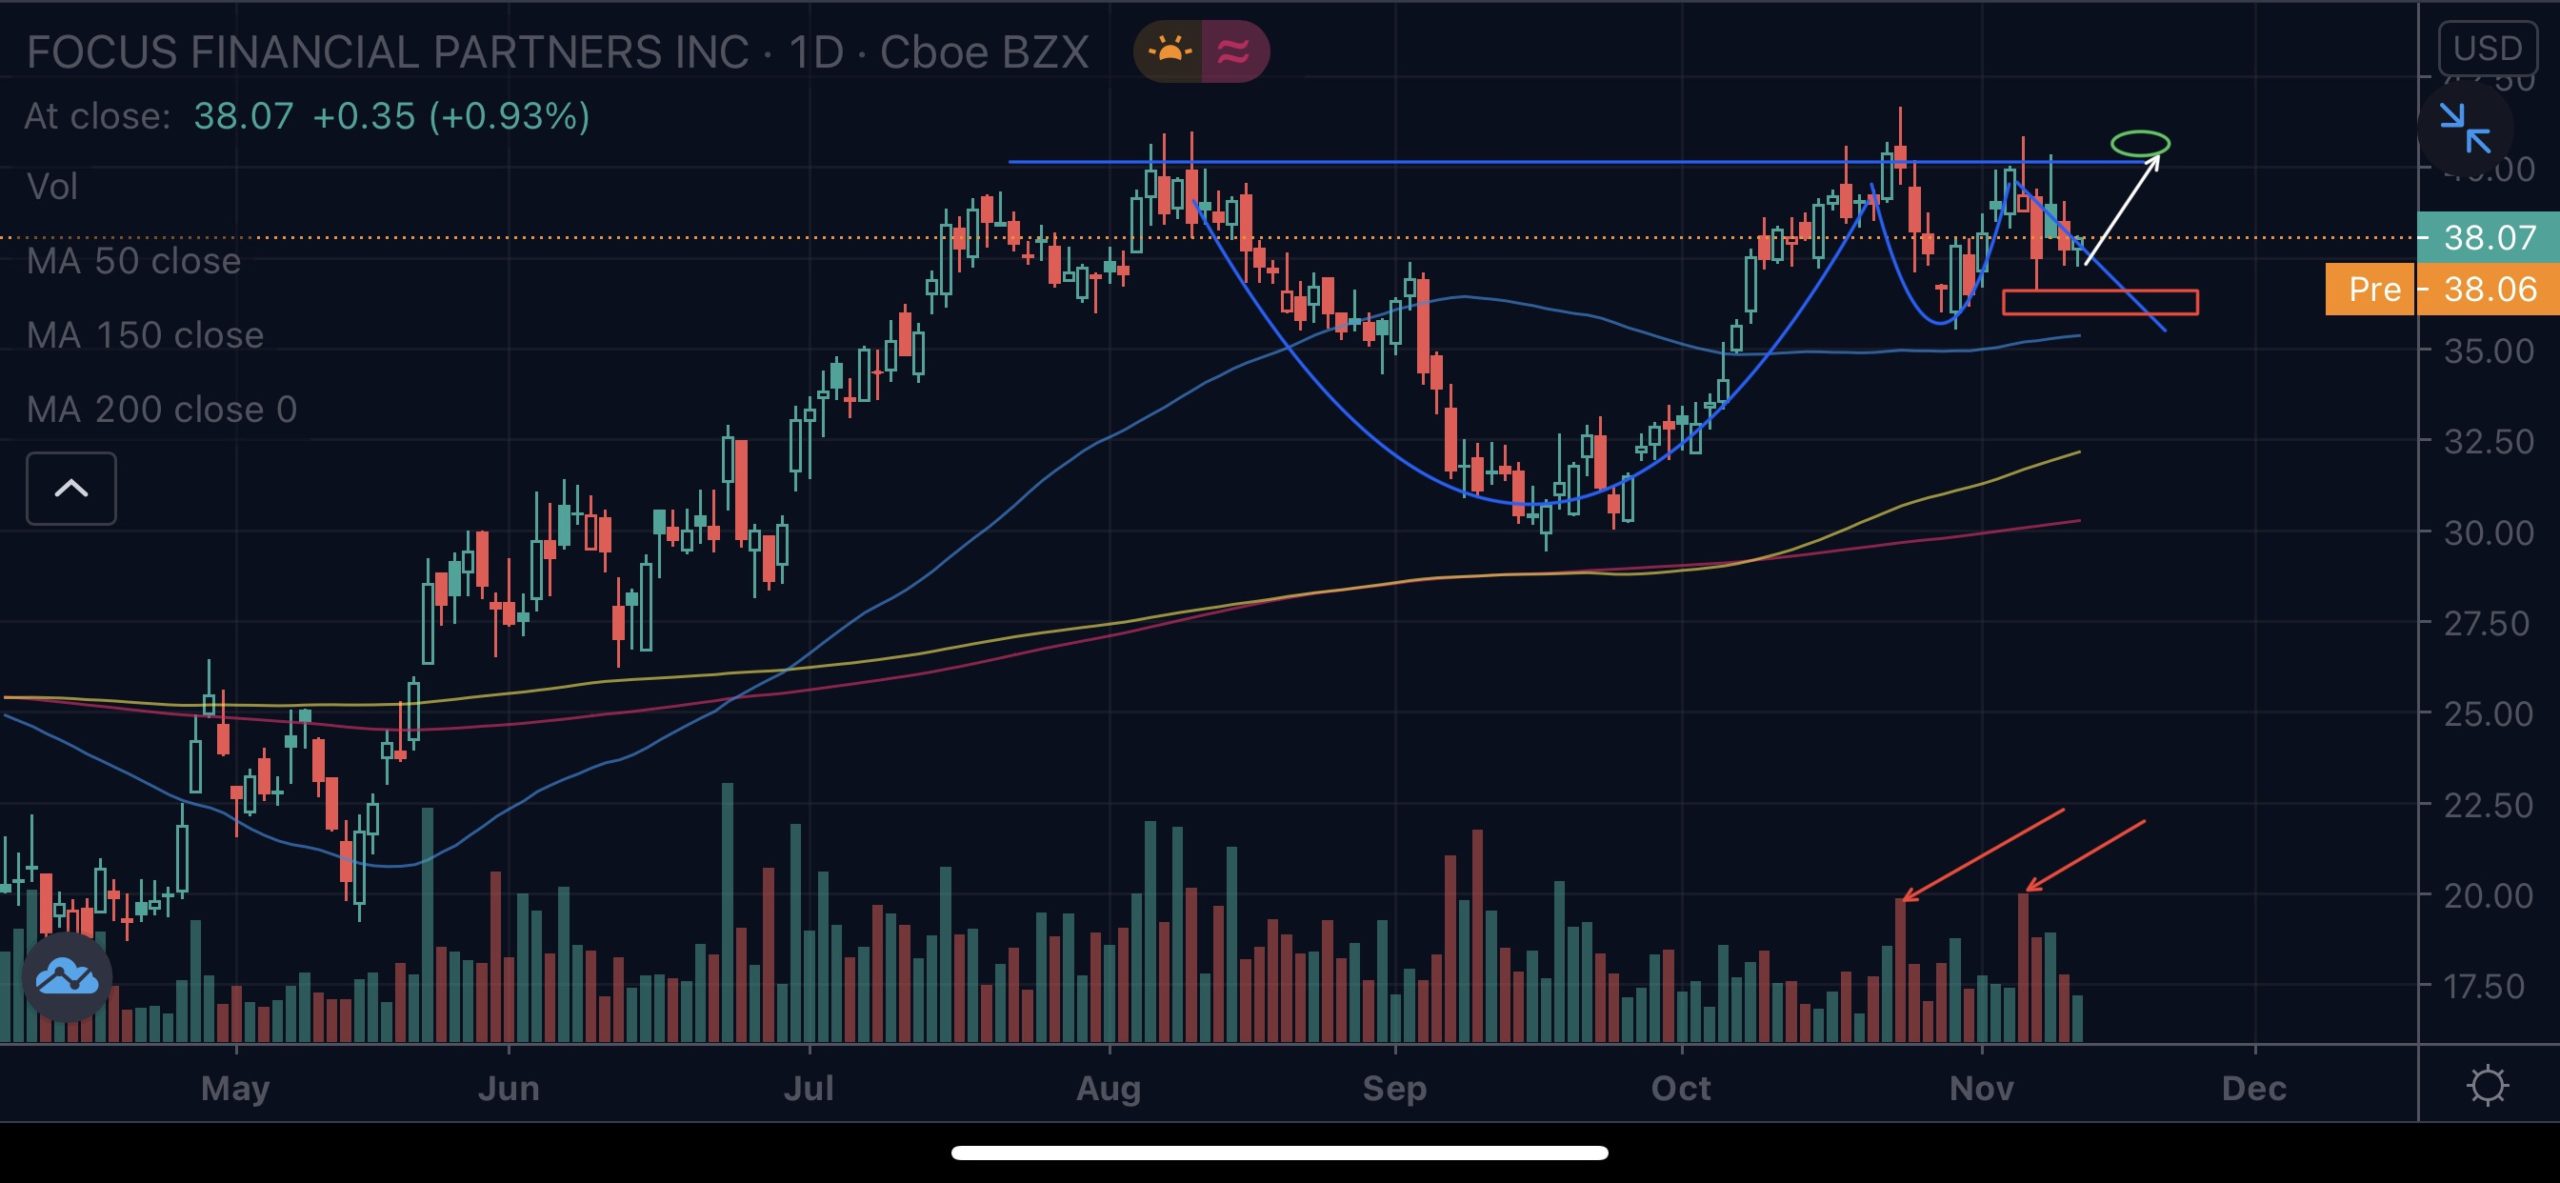
First is a stock with a pivot setup, but bad volume profile:
You can see that $FOCS has a volatility contraction pattern outlined in blue, which is evidence of institutional buying, but the red arrows in the volume profile point to a flaw: big selling on down days. So this flaw makes me want to focus less on this stock and find one with a higher probability of a break out driven by institutional buying.
The next stock I found with a better picture was $ASPN. You see a similar volatility contraction pattern, but condensed in the x-axis. I would prefer a stock that has taken a little longer to consolidate because more time means more impatient sellers have given up and are out of the stock, which means less potential sellers as the stock moves higher. So this is ok, but I want to find a better stock to spend my attention on during the trading day.
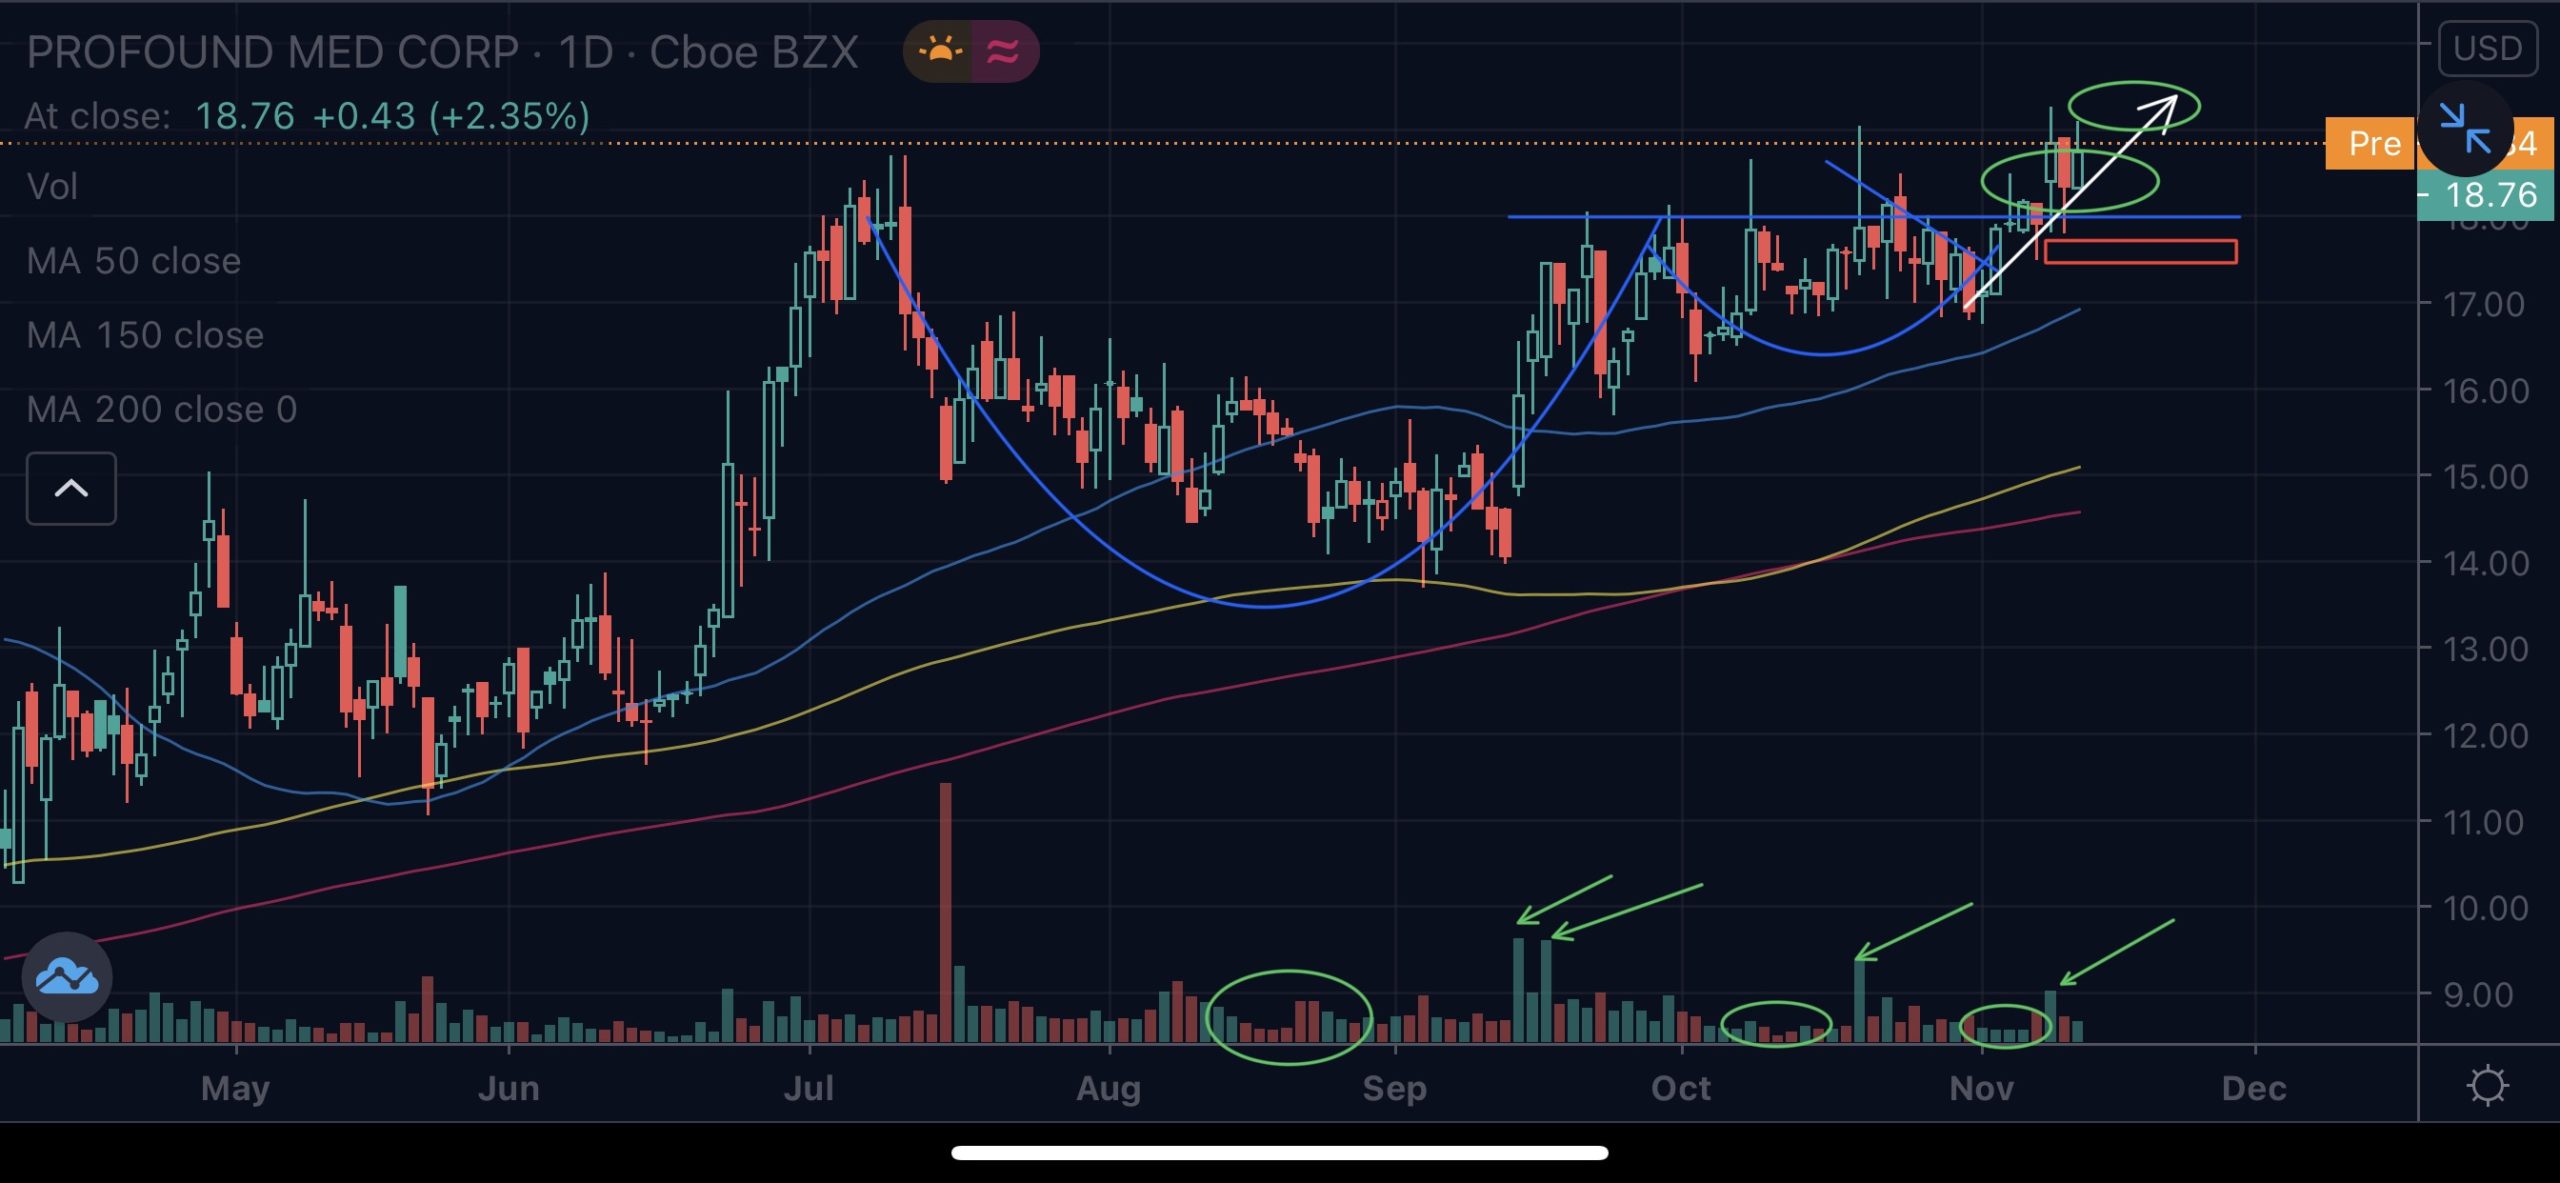
This last stock, $PROF is a good example of a stock I want to really concentrate on for a purchase. We see the same contraction in volatility outlined in blue, two buy points in green, and the green arrows and circles on the volume profile point to high volume on up days, and dried-up volume in the low parts of the volatility contraction pattern. All of this is text book evidence of institutional buying. On top of this technical footprint, see a large increase in earnings in the latest quarter. This could mean the start of an earnings growth story that drives increased attention by institutions and more buying. This is the stock to watch!
Our attention is limited, better to spend it on high probability trades. I like to filter down stocks to only a hand full, and then I want to focus on the one or two that I think will work. Then I take the trade as it moves through the pivot, and size up the next trade if this one works out.


