Saint Joe ($JOE)-a real estate developer. Trades at 2 billion Dollar valuation. They could make tons and tons of money on developing Walton Beach/ Destin, Florida. But 45% of the shares are owned by a Berkowitz of Fairholm capital. He could unload his shares or do something with the company that’s not in the best interest of the shareholders. I’ll pass on $JOE for now.
$MITK, $ECOM, $LQDT, $CCEL. These are all really good looking stocks that I’m interested in as long as they hold around the 200 day moving average or break to new highs. PEs are in the 20s & a possibility for rapid earnings appreciation.
Some stocks I’m curious about:
Travel Centers of America ($TA) vs. clean energy fuels ($CLNE)- I like the set up on $CLNE so checking out the valuation: it has a $2 billion market capitalization, and about $900 million in assets. If you take the maximum return on assets that Travel Centers of America earns and multiply that by the $900 million of assets you get something like $50 million of earnings which would put $CLNE at about 40 times earnings? I like $TA better as a buyout candidate maybe by Blink Charging stations? $TSLA? Who knows- the auto market, and thus the auto filling market are in flux. But I’ll pass and just watch both $TA & $CLNE for now.
Ethan Allen ($EA) vs. Restoration Hardware ($RH). RH is obviously fancier and gets a much higher multiple- it does have much trendier and more in fashion furniture and really sleek show rooms plus a lot of room for growth. I think this trend can catch on nationally and keep growing in the metropolitan areas. Ethan Allen has more traditional furniture in differentiates itself by its white glove install treatment which is not going to be desirable for anyone under the age of 40. But it is much safer because it’s been in business for so long and has absolutely no debt so I’d prefer Ethan Allen, but sporting a 20 PE multiple, I’ll just watch these two from the sidelines for now.
September 17, 2021
by Patrick Comments Off on Taking Risk in an Era of Immeasurable Risks
Investing is getting harder- because we are all slowly understanding that the game is not what we were taught it was. (If it’s not clear to you now that we are not operating under the rules of capitalism, then there is no use in convincing you- you are a lost cause and likely a mindless consumer who allows the TV to “inform” you about reality).
The reason investing is getting harder is because risks are compounding and immeasurable. It is becoming more apparent our leadership is completely inept, and we are being mislead about virtually everything: White House press briefings are 100% narrative creation and spin, and journalism is an echo chamber. The press has no power to seek truth or inform the public. So we the public have no ability to make informed decisions about how to act. A case in point: we are in a new cold war and are going through the equivalent of nuclear attack drills and crouching under desks. Ever wonder what it was like to have been a rational, thinking person and seeking your kids be told to hide under their desk during a nuclear attack drill? Wonder no more; vaccine mandates are exactly the same thing- not similar- exactly the same.
But, people are scared and misinformed so we travel further and further down an unknown road in the dark because we are following a map created by a blind cartographer. Similarly, the problem we face in investing is no different- we are making irrational decisions about how to take on risk because are misinformed about what risks actually are.
The WSJ article above is actually some valuable journalism in a mainstream publication, which is rare. Through the article, Jason Zweig gets the reader to focus on taking risks vs. seeking risks.
Modern portfolio theory is the exact same as a White House press briefing- not similar, but exactly the same. We all gather in a room and Wall Street tells us professional investors how to think about investing. There are credentials (CFA designation) that anyone in the “press room” must have that weed out any “wrong thinking” just like any one with a press pass has been filtered through a journalism school and received a press pass.
We are mislead to think that risk is volatility, and volatility is a standard deviation of returns around a mean return. But, anyone living in reality must know by now that this is nonsense. And yet, all savings across the developed world are invested as though this concept is a reality. It worked in the USA up until the dot com crash. Then the Fed embarked on a mission to uphold asset prices. The Fed wasn’t the first and the dot com bust wasn’t the first evidence that portfolio theory is a crackpot theory- Japan and their boom and bust in the 80’s and the Bank of Japan’s QE was the first event that proved modern portfolio theory was indeed a crack pot theory. But men in charge of society followed irrational policies anyway- same mentality that brought civilization into WW1; they all knew going to war was insane, but no one seemed able to stop anyone else from traveling down the road to war- following a map made by a blind cartographer.
So how, as investors, traders, speculators, and any guy who’s come to the realization that the economic system is mostly rigged and real wealth is not going to be attainable by honest means take on risk when our risks are immeasurable?
The answer lies in balancing our decision making between two engines: our intellect and our imagination. Under the classic rules of capitalism, we would want to bias our decision making heavily towards intellect and mostly ignore our imagination. Now that it’s apparent the USA no longer operates under a capitalist system, we’ve got to incorporate our imagination more. But letting imagination take over our decision making can lead to errors the same as trying to use intellect to make decisions (alt-coin cyrptos and NFTs appear to be letting imagination run too wild, while Bitcoin and maybe Ethereum appear to be using just enough imagination).
So use your intellect to analyze industries of interest, read 10-k reports, and assess the general conditions. Use your imagination to understand to determine what is reality.
September 10, 2021
by Patrick Comments Off on Deciphering Entrails: remembering 9/11 and the Iraq war
When Guthrum the Viking king was planning for war with England’s Alfred the Great, he would seek the council of his high priest. The priest would divine from the entrails of rabbits wither the gods favored Guthrum on that particular day. This is exactly how pagan war-room planning sessions went.
When Bush’s high priests: Rumsfeld, Rice, & Powel; were in their war planning sessions for the invasion of Iraq, they got together and decoded intel trails that had equal evidence for and against the possession of WMD by Saddam. They deciphered the intel in a way that gave them reassurance now was the time to go to war. This is not a similar thing to Guthrum’s high priest deciphering entrails; it’s exactly the same thing in every single way.
When pagans needed rain for a good harvest and thus increased prosperity, they looked to their chief priest to perform a rain incantation or dance ritual. This is how pagans actions were a result of their belief in the ritual having some efficacy.
When we want our stock market to go up and thus increase our prosperity, we look to our Federal Reserve Board of Governors to lower the discount rate or engage in another round of QE. There is no actual mechanism by which increasing bank reserves (the outcome of QE) can increase asset prices. The mechanism is a fluid coupling, not mechanical- QE influences investor preferences towards riskier assets- that’s it. That is the sole linkage between QE and asset prices. We believe QE and lower rates make asset prices go up. Our behavior reflects our belief- so we collectively acquire assets and hesitantly dispose of them. So price goes up. This is not a similar thing to pagan rain dances, it’s the exact same thing in every single way…
August 11, 2021
by Patrick Comments Off on Price vs. Priceless
We can learn a lot about investing in stocks from these MasterCard commercials by examining more deeply the contrast between price and value as depicted in the advertisements.
Let’s examine some observations and beliefs about price- An example: -price of an iPhone 12: $1,000 -price of oxygen we breath: $0 Which has more value to us? Another example: -price of a new Honda Civic: $25,000 -price of your child’s life: ??? (Obviously priceless) Yet another example: -price of a gallon of gasoline: $2.75 -price of transporting yourself and your stuff the 20 miles a Honda Civic would take you on one gallon of gasoline: ??? (A lot more than $2.75)
We can see clearly from the examples (exaggerated as they may be) above that price is not determined by value. In some cases, the two are not even remotely related.
Warren Buffet likes to say that price is what you pay, value is what you get. When we use price as a measuring stick for value, we are showing our representative bias: our tendency to believe that one thing does in fact represent what it claims to*. But when we examine price in relation to value, we can conclude that price often fails to represent the relative value of the thing being priced.
In investing, we ascribe a great deal of meaning to the price of stocks. The price of a stock is what we focus on. The price of a stock is how we measure our wealth. The price of a stock is how we determine the relative performance of one company versus another. The price is what receives all the attention of investors, and yet, the price in some cases tells us nothing of the value of the object being priced.
I like to take this observation to the extreme. What if price not only tells us little about the value of the object being priced, but in fact there is an inverse relationship to the price and its inherent value? Let’s look to several examples: -price of annual salary for LeBron James: $39,000,000 -price of annual salary for trash collector: $38,000 Which job is more valuable to the functioning of society? Another example: -price of a Coke: $1.75 -price of a glass of filtered tap water: $0.50 Which option has more value? And yet another example: -price of a share of $TSLA: $700 -price of a share of $HMC: $30 We can site many examples of two contrasting objects where the cheaper priced option is of far greater value.
Admittedly, it is not practical for everyday living or successful investing to hold the view that the more expensive option is of less value. There are many examples where a more valuable option is the more expensive option**. However, this view is useful for developing a contrarian mindset that is essential for measuring value.
Value investing requires the investor to take a contrarian view that the price is lying about the value of the stock in question. This view is not easy to hold when highly priced stocks you assess to have low value keep going up in price, and lowly priced stocks you asses to have high value keep going down in price as is often the case.
Much of the time you see a price going down on a stock you asses to be high value, it is the price that is telling the truth and your assessment that is wrong. However, the inverse is usually not true, and often times far more painful for the investor.
A stock that goes up in price that you deem to have low value will most of the time keep going up in price. It generally will keep going up after that. And it just keeps going. In this case, your assessment of the low value may not be wrong. That is the more painful experience of being wrong. There is no resolution to this as there is in the case of assessing value too high to a low priced stock. In these cases of wrongly assessing a high value, events unfold that reveal the mistake in your assessment of value. In the case of wrongly assessing too low a value, many times events unfold to prove your assessment correct, and yet price keeps going up.
We would never expect that LeBron James’s salary to level out with that of a trash collector relative to their respective indispensability to society. Similarly, we should not expect the price of any stock to level out with its respective value to the economy. In fact, we should not expect the price of a stock to tell us very much at all about anything related to objective reality. That is what makes investing fun- realizing that at its core, investing is just a game. The winner correctly identifies stocks whose price, not value, is going up for any reason or no reason at all. It is scarcity and demand at a point in time that determine price, not value. It is a belief that a value should have a high price. If this belief were universally true, oxygen would be the most expensively priced commodity in the world at all times.
*(This bias is what, in part, contributes to our belief in brands: a logo represents some desirable quality such as social status, craftsman ship, etc. The brand’s logo may very well represent such qualities in fact, but sometimes may not. Sometimes, it is merely our belief in such brands). **(A high quality, tailored apparel item vs. a cheaply manufactured one for instance).
June 23, 2021
by Patrick Comments Off on Gold bidding for oil
“A Child having taken notice of nothing in the metal he hears called gold, but the bright shining yellow colour, he applies the word gold only to his own idea of that colour, and nothing else; and therefore calls the same colour in a peacock’s tail, gold. Another that hath better observed, adds to shining yellow, great weight; and then the found gold, when he uses it, stands for a complex idea of a shining yellow and very weighty substance. Another adds to those qualities fusibility; and then the word gold to him signifies a body, bright yellow, fusible, and very heavy. Another adds malleability. Each of these uses equally the word gold, when they have occasion to express the idea which they have applied it to; but it is evident, that each can apply it only to his own idea, nor can he make it stand as a sign of such a complex idea as he has not.” -John Locke, An Essay Concerning Human Understanding
In 1998, ANOTHER expressed his idea about how to value gold and how to think the prices of things we use like oil. Specifically, in a post from Jan 1998, entitled: The final outcome of “Too Much Oil”, “Too little Gold” and “Worldwide Digital Currencies” he laid out how the price of gold vs. the price of oil has little relation to the value of gold vs. the value of oil.
A key takeaway was that the price of oil could be made extraordinarily cheap, if the price of gold were to made extraordinarily high. Ever since May 2020, when WTI crude cleared at negative prices, the idea of what gold bidding for oil means became clear.
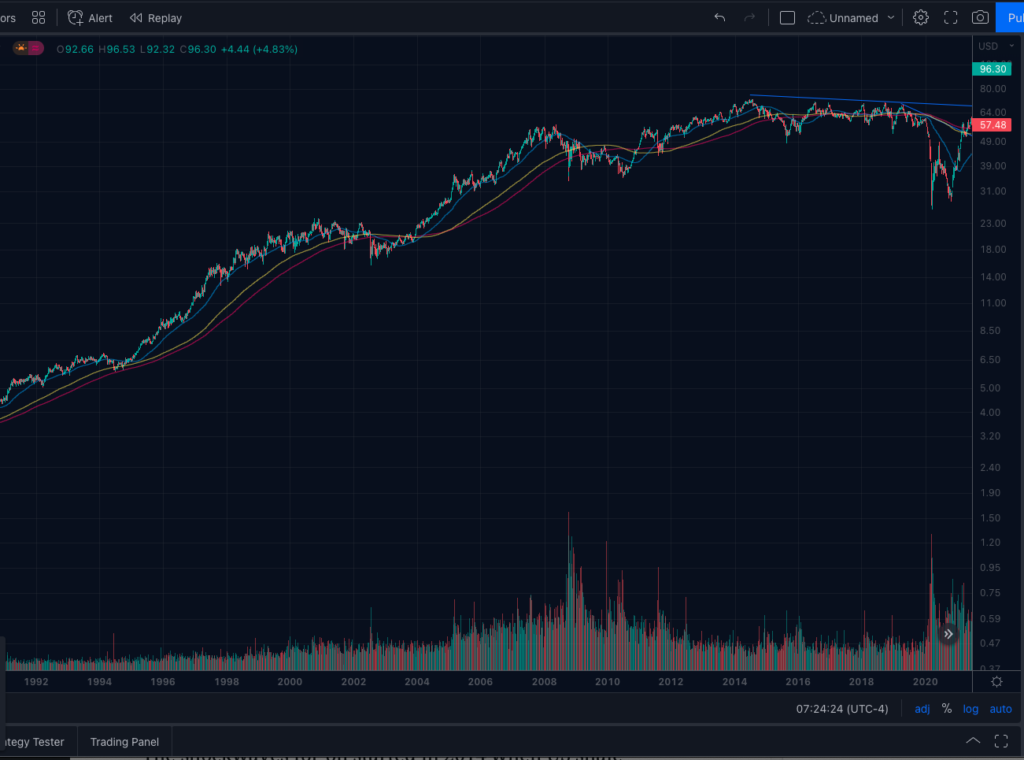
Consider this chart of $XOM:
We can see the possibility of a long term top in the oil company.
Usually such a drastic movement in a major stock should be dismissed. However, when ANOTHER’s idea is taken in conjunction with the price chart and the negative clearing price of oil in 2020, the possibility of a repricing of oil becomes apparent.
The shockwaves for oil started in 2014 when US shale oversupplied the market. All oil companies, even XOM, have had to take down their book value based on a lower price for reserves since that time.
As ANOTHER writes:
“Now we approach the final act.
There is one oil state that no one will play for a fool. The CBs will sell all of their gold or the nations will nationalize all mines and operate them at a loss. One way or another, most of the paper gold market will be honored. Why? Because oil will bid for gold if they do not! We are not talking about an oil embargo or rising oil prices. Indeed, oil will become very cheap for those that can supply physical gold. This deal will not require the agreement of all oil states. Only one can start this, the others will gladly follow.
A large oil producer, with plenty of reserves and unused capacity, can say: We now value gold at $10, $20 or $30,000/oz.. That is the rate we will use to sell oil. We will go to “full” production and offer at $10.00us/bl.. Pay us in physical gold and USD ( or EUROs ) as a 50% mix to the above rate to equal $10/bl..
It would be a deal like none other! Oil, worldwide, would drop to $10.00/bl and every economy would do very well, IF they had gold. All gold would immediately be arbitraged to the above prices thereby creating a “world oil currency” large enough to handle oil. This creating of a new “specialized currency” will be the result of the first “commodity corner” that ever succeeded!”
Which oil state could do this? Perhaps the photo below holds a clue:
$10 oil and $1.25 gasoline would be a boon to every oil consuming economy on earth.
But what of the oil producers? Under a gold-for-oil pricing scheme, the oil state would have secured wealth in the form of gold that will last as long as humanity exists on earth. Accepting a lower USD price for oil at break even around $10, and a fraction of an ounce of gold for each barrel of oil sold would render the oil state more diversified. This seems to be a reasonable desire for an oil producer.
Which brings me back to the chart of $XOM. If this gold-for-oil pricing scheme is imminent, the price action and breaking of long term trends in $XOM is exactly what one would expect…
June 4, 2021
by Patrick Comments Off on Market under distribution
Looking at a weekly chart of the S&P 500, we can see clearly that the market is under distribution- professionals selling into strength.
The white arrows show good volume on the breakout that gave traders confidence to keep trying the long side with nice, tight setups even though breakouts weren’t leading to sustained momentum most of the 1st quarter.
However, now the change in character of the indexes is confirming the poor action and lack of follow through on breakout setups. The first red arrow on the price candle shows the first distribution day after the rally from $3,500 on the SPX. All the red arrows on the volume graph show increasing volume on down days. This is a tell tale sign of professional selling on the way up.
The market is leaving speculators clues as to the future direction. Selling with the pros is what disciplined speculators should be doing until the price and volume say otherwise.
June 1, 2021
by Patrick Comments Off on Has Bitcoin topped out?
A common theme I perceive while researching hyperinflation‘s of the past, is that normal people had no perception of the imminent collapse of theirs political and economic systems.
In the case of the German and Austrian hyper inflations, normal people could not even perceive that a collapse was possible. However in the Soviet collapse, average citizens knew of the inevitability of a collapse, but could not see that it was imminent.
Today we have all the signs of an impending collapse: rampant speculation in the stock exchange by the least financially literate portions of a society, entirely new products to speculate on like cryptocurrency’s and NFT’s, a vast divide between the wealthy and the average citizen, discontented citizens storming government buildings, the government sending out money to people who can’t work, and most prominently, central banks buying assets to keep the system from collapsing.
These are all telltale signs of an impending collapse, but life feels still a little bit too normal to envision a collapse. We’ve seen only minor disruptions in our supply chains. The grocery stores are now restocked after being out of everything after covid lockdowns. However, we see some prices of lumber skyrocketing currently. Perhaps this subsides, or perhaps it becomes the first of many bottlenecks causing inflation.
The first signs of hyperinflation actually came in the healthcare price inflations of the Affordable Care Act. We saw our healthcare go up by hundreds of percent over several years. If that was the actual beginning of the hyperinflation, we are already at least five years into it.
In St. John’s Apocalypse, the black horse comes after the red. (See here).We’ve likely already seen the red horse as the communist plot from the 1920s to now. The black horse ushers in the era of a loaf of bread for a days wages. This is the coming hyperinflation.
It is easy to see the collapse’s inevitability, however, similar to the Soviet experience, it is quite difficult to pinpoint its precise timing.
May 19, 2021
by Patrick Comments Off on Leadership Profile
What constitutes stock market leadership? Can leadership be systematically determined? Is the market currently undergoing a leadership transition?
We’ve all experienced leadership- like AAPL dragging up the whole market during the QE period. AAPL and the whole FANG complex has been the leadership that has spilled over into the software group, and the technology sector as a whole.
While the SPX is making new highs, several of the FANG members have not been leading the general market higher. AAPL has a precarious situation technically, with a reversal looking more likely the longer it drifts down to $120.
NFLX is at the bottom of its range, AMZN had a failed break out to new ATH’s at $3,500, and FB, MSFT, and GOOG are only half the team holding in an uptrend.
Because we lost half the FANGs, the operating assumption should be that the market has lost its main leadership. That is why it is hard to buy any breakouts- most have no followthrough. There is no leadership. Institutions have ceased to buy like they have been since the Trump election night rally took off in 2016.
Cyclicals are deemed by some to be new leaders- but we lacked the most important element of a leadership change to confidently say cyclicals/ energy/ commodities are the new leadership: a market sell off.
From my research, it is apparent that any major leadership change happens from a modest correction- say around 10% or more, and after a prolonged bear market period, say 3 months or more.
We have had neither of those events. That is why we’ve got to operate under the assumption that we are still in leadership faltering mode. Unless AAPL can shakeout and move up, and take the QQQ’s with it, then what 1/2 the FANG group is saying is that the general market is heading into a very risky period this year.
Any new “leadership” should be considered a laggard group. We have had 4 years of rallying interrupted only by COVID crash, and this last rally since April of 2020 feels more like the final blow off top of the big rally that started in 2016 than the first leg of a sustainable rally.
A worst case scenario is that this is the blow off top of the rally that started in 2009. But there is too now way to determine that 2010ish wasn’t the start of a 20 year move up. There is some evidence for this, but equal evidence that 2020 could be the start of 10 year consolidation period for the market.
I’m leaning towards the scenario of 10 more years left in this bull run simply due to the fact that the Fed is not considering raising rates, and all my research suggests that virtually every decline of lasting magnitude in markets is caused by a period of Fed raising rates or some form of defecto monetary tightening.
Until we get a decent correction, we await the new market leadership.
May 14, 2021
by Patrick Comments Off on Setups Weekly followup
To end the week, here is a follow up of all the past daily setups. There are some winners and some losers. So the key is still to adhere to stops (10% maximum loss) and keep position sizing constant until there are less losers. After the win rate gets a little higher than 50%, sizing up will be key. Over the past week, we have 5 wins and 7 losses for a 42% win rate.
$AMRK up 10%$WGO stopped out 9% loss$WWD stopped out 6% loss$SAH difficult but doesn’t look like a hard stop yet, still in the position, down 8%$AQB stopped out, 10% loss$SMED still in the trade, up 3%$FCX up small 1%$GTES still in the trade, down 1%$LZB stopped out, 3% loss$EHC still in, up 1%$FSK, stopped out, 2% loss$RDNT still in the trade at break even