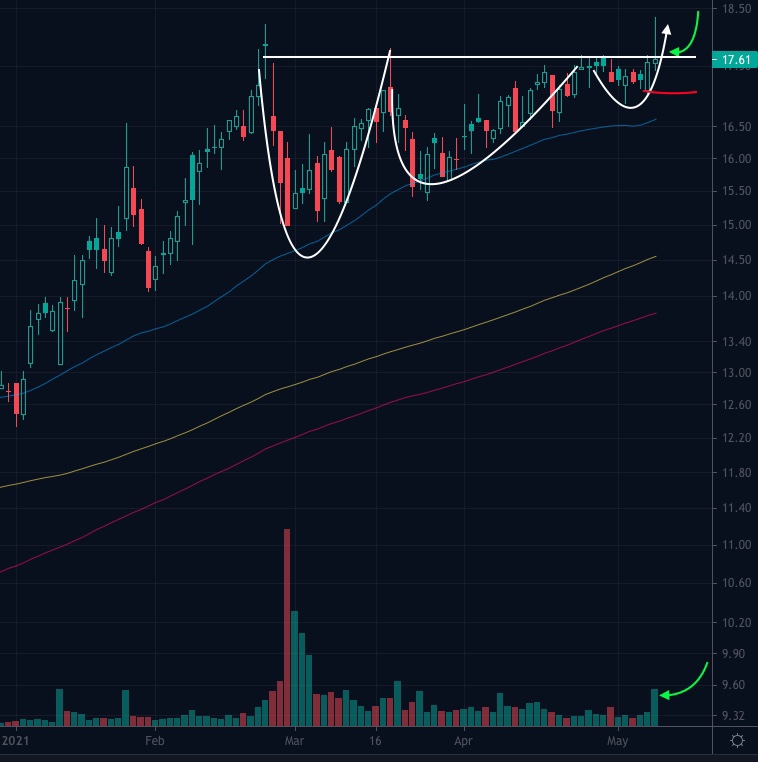
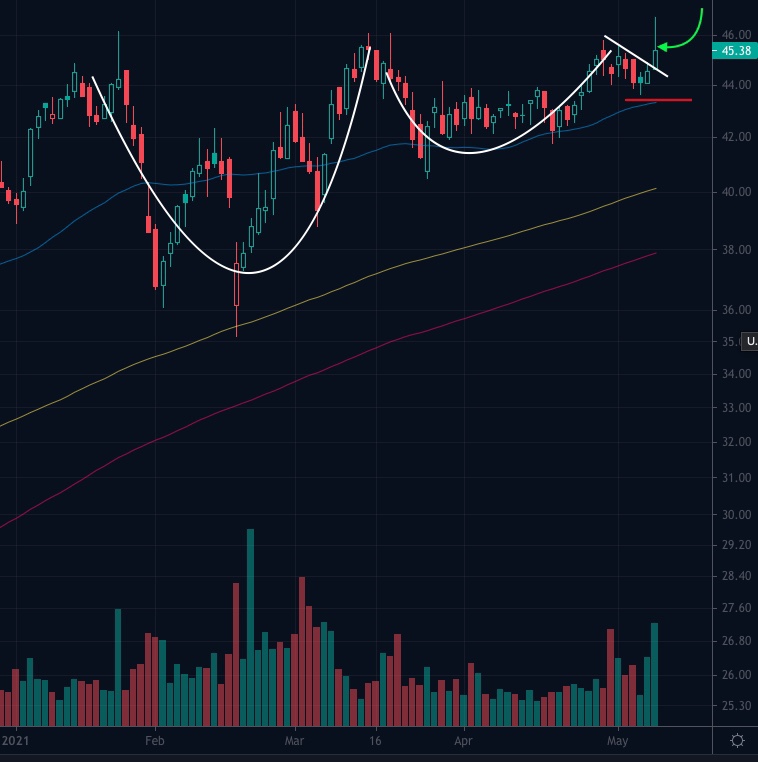
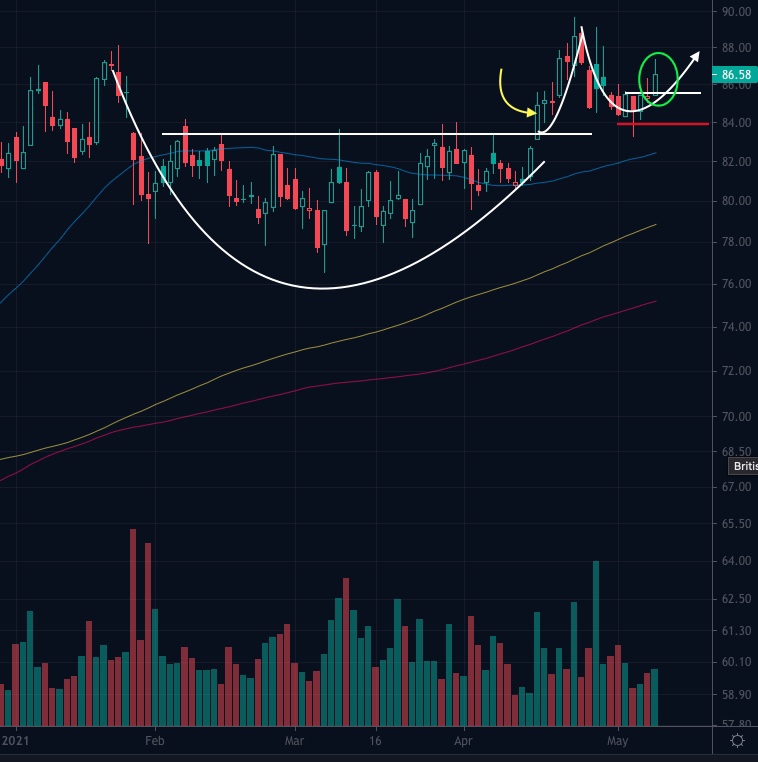
Here are a few more setups. Trading has been tough in breakout setups lately, so stops are essential.

May 11, 2021
by Patrick
Comments Off on Daily setups
Here are a few more setups. Trading has been tough in breakout setups lately, so stops are essential.


May 5, 2021
by Patrick
Comments Off on Stock setups
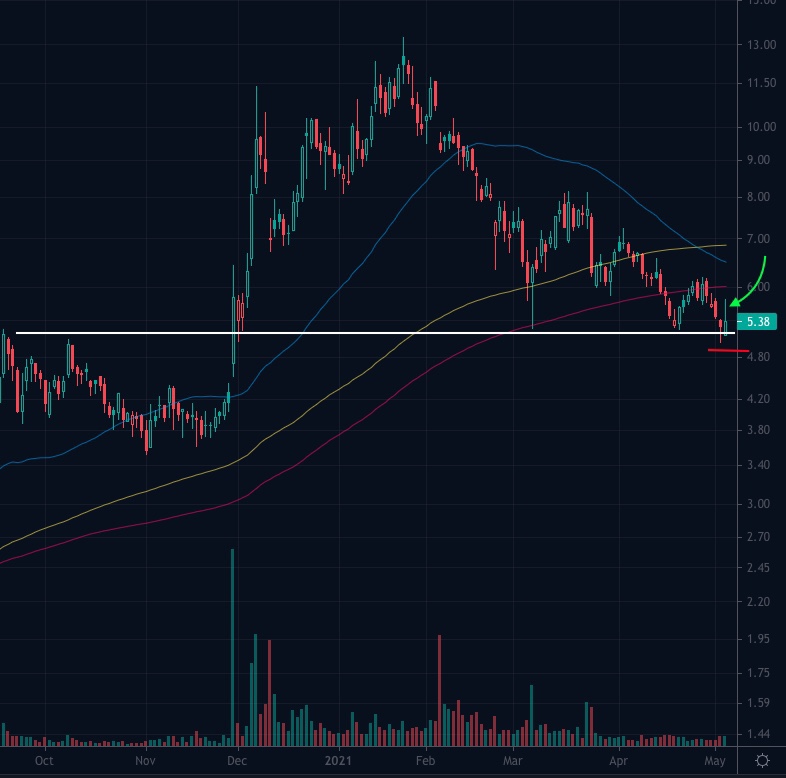
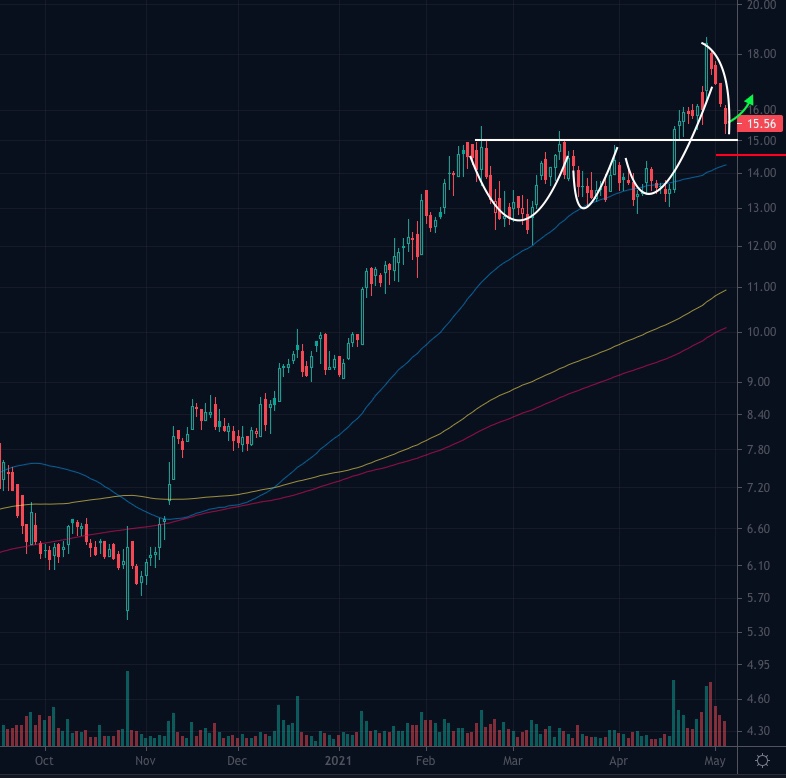
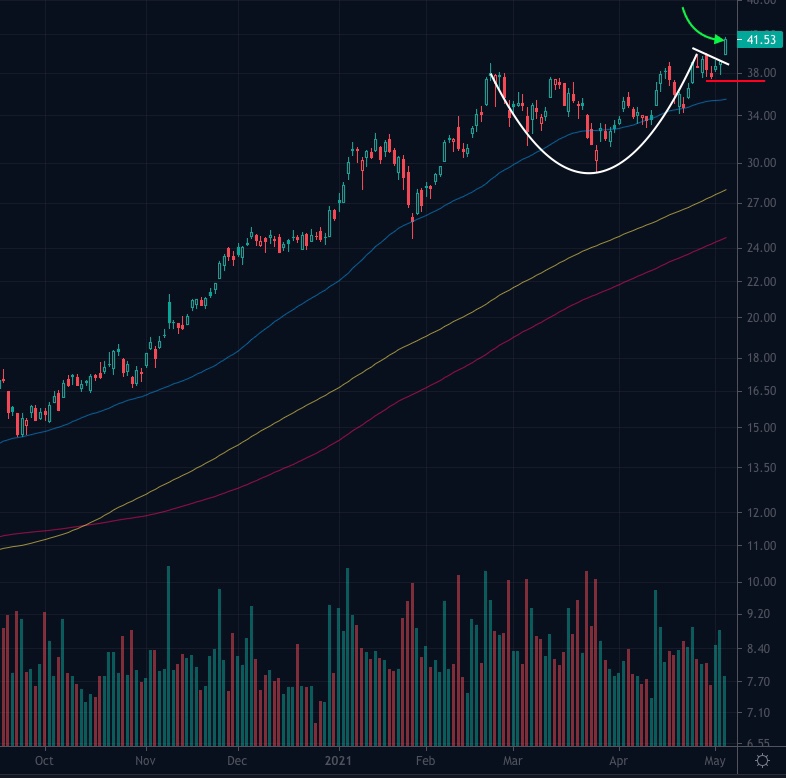
Break outs seldom working right now so here are some setups that include a couple support bounce plays:
May 4, 2021
by Patrick
Comments Off on Stock setups daily
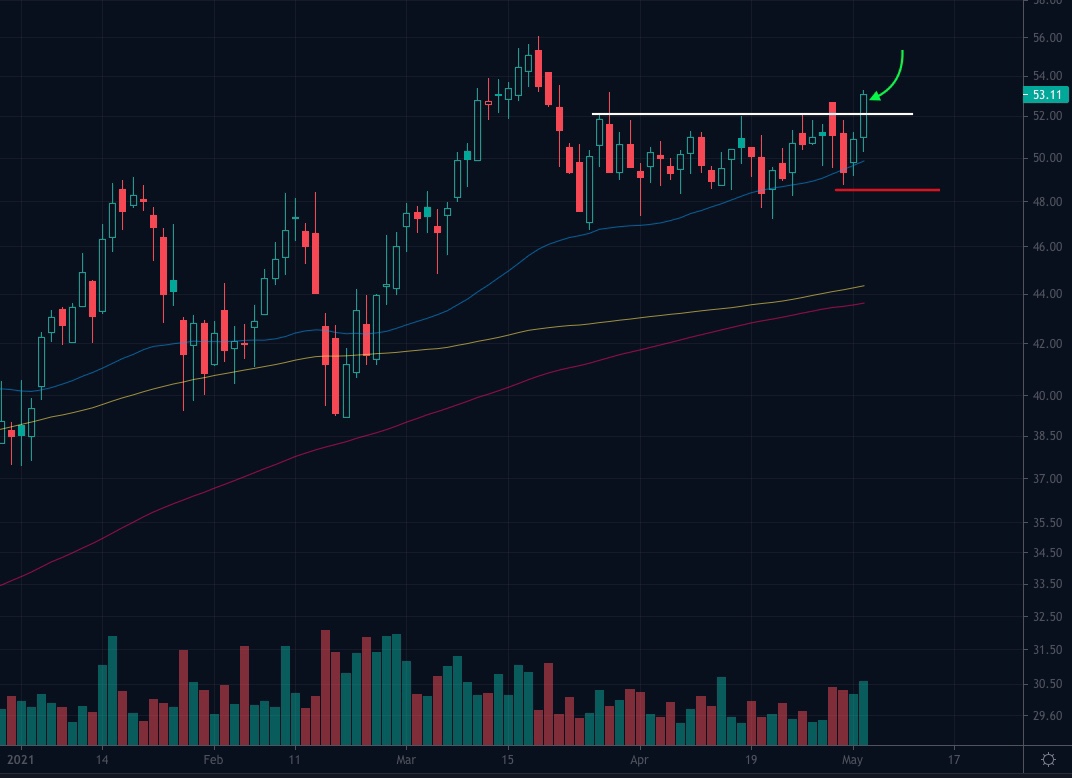
The rotation out of FANG and into cyclicals is alive and well. Here are 3 setups on cyclical stocks attempting to break out today: break out pattern in white, buy points in green, and stops in red.


March 31, 2021
by Patrick
Comments Off on Pension Obligation Analysis
Information pertaining to a company’s pension obligation can be found in three of the financial statements: the income statement, other comprehensive income, and the balance sheet.
The notes and disclosures to the financial statements also contains a lot of useful information that helps to understand what the company is responsible for paying to employees in the future.
Starting with the information presented on the income statement:
This is actually going to be the least informative of all the financial statements.
In the operating results section we will find the current periods service costs.
This is the amount that has been paid out two retired employees during the reporting period.
It will also contain some net interest income which should be small and not very significant.
The service costs or not helpful other then getting a sense of how much the service costs are going to take away from operating income in future periods. All future. So all future should be a little bit higher than the current one but not much.
The other comprehensive income statement is a little bit more helpful in determining how much the company is responsible for paying. Actuarial gains and losses will show up here. So if a company has constantly over estimated the return on assets, or under estimated future pay increases, or used inappropriate discount rates, there will be actuarial losses which subtract from retained earnings. This will give us a sense if a company is being honest about pension obligations, or if they are using unrealistic numbers to benefit current earnings.
The balance sheet is perhaps the most useful in determining what a company has promised employees.
We can go straight to the liability section because most companies will have an underfunded status. However, rarely a company may run an overfunded status, in which case the pension obligation will show up as an asset.
Under the long term liabilities we can see the pension obligation number. This will be a net number, meaning it is the present value of the obligation minus the total plan assets.
This number will also contain other post retirement benefits such as healthcare contributions etc.
For enhanced understanding we go to the notes and disclosures section of the financial statements. This will show us the assumptions the company is using to calculate the present value of its pension obligation. You can see if the discount rates and growth of income look reasonable. You could even plug in your own numbers to see what it will do to the present value of the obligation. A higher discount rate will make the present value of the obligation go down. Higher interest rates will also mean assets could grow more than the current assumed rate of growth. Of course too high of interest rates could signal and inflationary environment which would mean both bonds and stocks can decline which would cause all kinds of problems for pension plans.
As with any fundamental analysis, the analysis is subjective rather than objective. One must use judgement when assessing strength or weakness based on financial statements, but a good rule of thumb is higher obligations are obviously sign of weakness.
January 29, 2021
by Patrick
Comments Off on A Red and a Black Horse
In July ,1862, Saint Don Bosco of Italy recorded a dream he had: a vision of the red horse of the apocalypse. From this dream, he believed God was warning him about the first wave of evil to fall upon the earth during the last age of man.
Five years later, Karl Marx would publish Das Kapital and the Communist Manfesto, which Marc and Fredrick Engels co-authored more than 20 years previous, was gaining popularity with the socialist movement.
The red horse in Don Bosco’a dream was the ideas of Communism that led to Bolshevism and Natzism.
The war that is the red horse would soon be unleashed on humanity with the total war of destruction in 1914.
In the summer of 1917, the town of Fatima, Portugal witnessed a Marian apparition- where Mary revealed that unless Russia was concecrated to her, it would spread its errors throughout the world. This was the year of the Bolshievik revolution, Russia was never consecrated and the intensity of WW1 increased.
The destruction lasted through WW2, the Korean War, Vietnam War, the first wars in the Middle East and the wars on terrorism and ISIS. The 100 years of war now culminates into the infanticide of the present, where roughly 20% of all human beings conceived are killed before they are born. Society is telling us they are not humans. The first step in a genocide is always to dehumanize the victims.
After being immersed in war for a century, there is no place on earth left for warfare, and there are no enemies left to make war with, so we make war in our own bodies with our own children. The age of war is coming to a close as there are no more fields of battle.
Next we should look to the black horse to bring the great hyperinflations to our economic systems: A days wages for a loaf of bread.
We have set up our economies just as Germany after WW1, before the great hyperinflation that brought about Nazism. However, this time all the large world economies are setting up their economies in the exact same way. This time the hyperinflations will be global events.
As this decade unfolds, it should become clear to most that we are ushering in the black horse of the apocalypse. But we won’t call it that, just as today we don’t refer to the past 100 years of war by its true identity: the red horse. The code for the black horse will be “economic crisis.”
The difficulty of understanding our situation is compounded by the fact that the outcome is deterministic- we can change course to prevent this from happening to us. If we choose to as a unified society, we could postpone this prophesy from being fulfilled…
November 12, 2020
by Patrick
Comments Off on How to follow a trade plan
All profitable traders have the ability to stick to a well crafted trade plan. A good trade plan starts with a good stock watchlist. What is the best stock screening software for making a watchlist? I like Ycharts but there are others.
Once you have been following your watchlist long enough to have identified key pivots in stocks that have evidence of institutional buying, you will need to drill down into technical analysis to focus on the highest probability trades.
Here are some examples of stocks with pivots that I identified last night and am watching for the next couple trading days for solid breakouts. Some stocks have higher probability for success, but let’s start with the lower probability stocks first, identify their flaws, and move up to the highest probability trades.
First is a stock with a pivot setup, but bad volume profile:
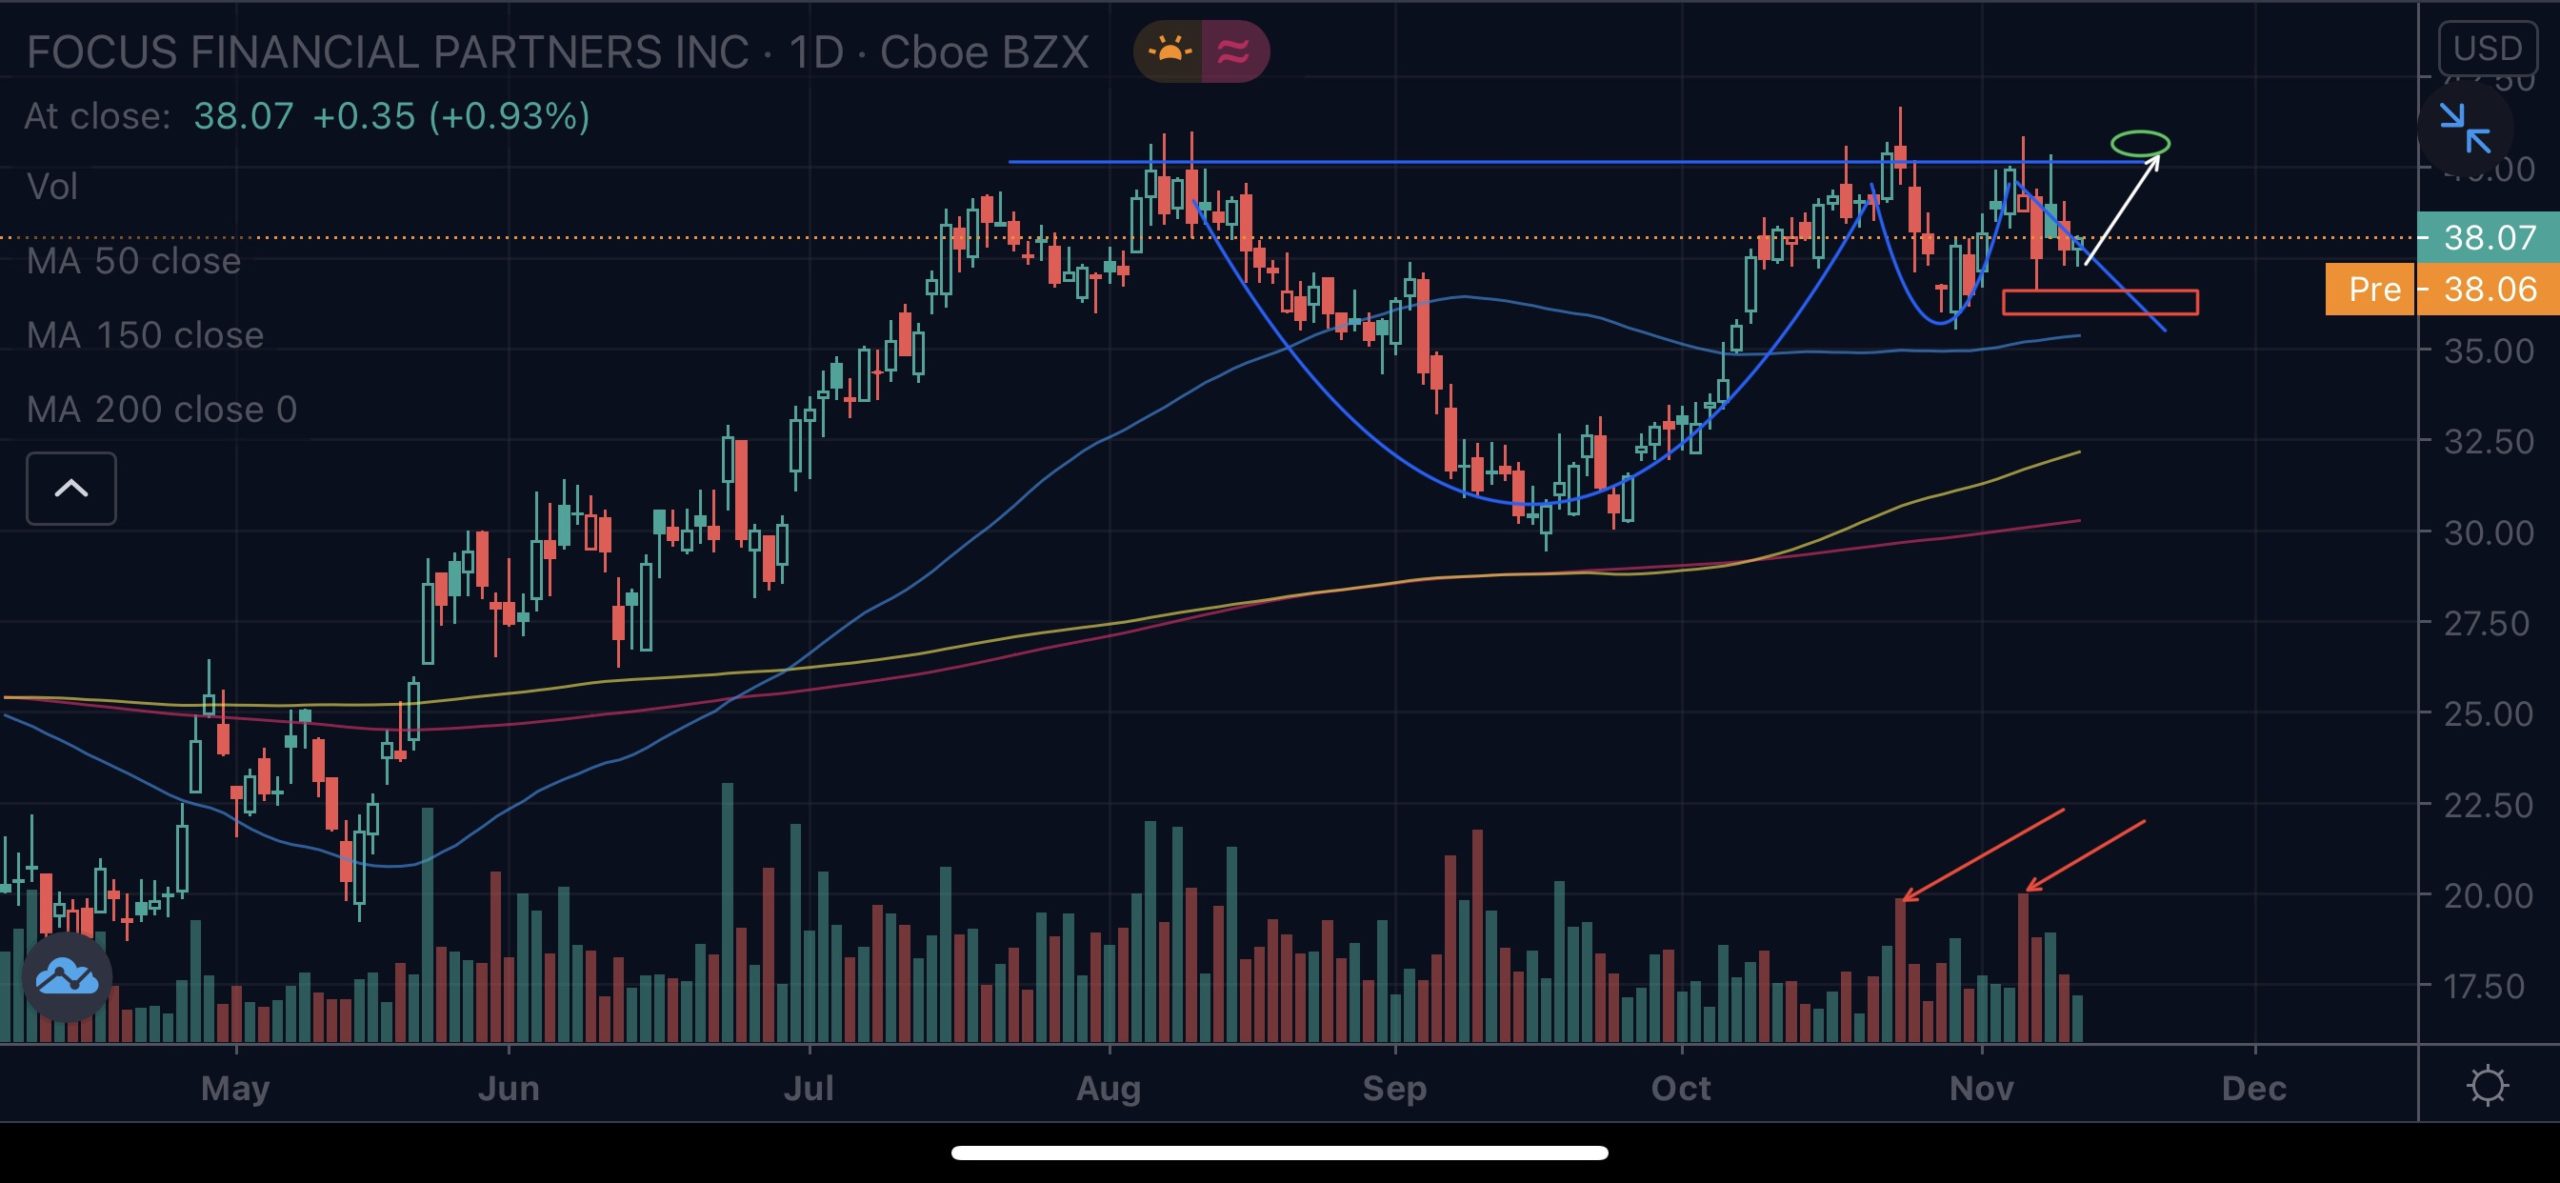
You can see that $FOCS has a volatility contraction pattern outlined in blue, which is evidence of institutional buying, but the red arrows in the volume profile point to a flaw: big selling on down days. So this flaw makes me want to focus less on this stock and find one with a higher probability of a break out driven by institutional buying.

The next stock I found with a better picture was $ASPN. You see a similar volatility contraction pattern, but condensed in the x-axis. I would prefer a stock that has taken a little longer to consolidate because more time means more impatient sellers have given up and are out of the stock, which means less potential sellers as the stock moves higher. So this is ok, but I want to find a better stock to spend my attention on during the trading day.
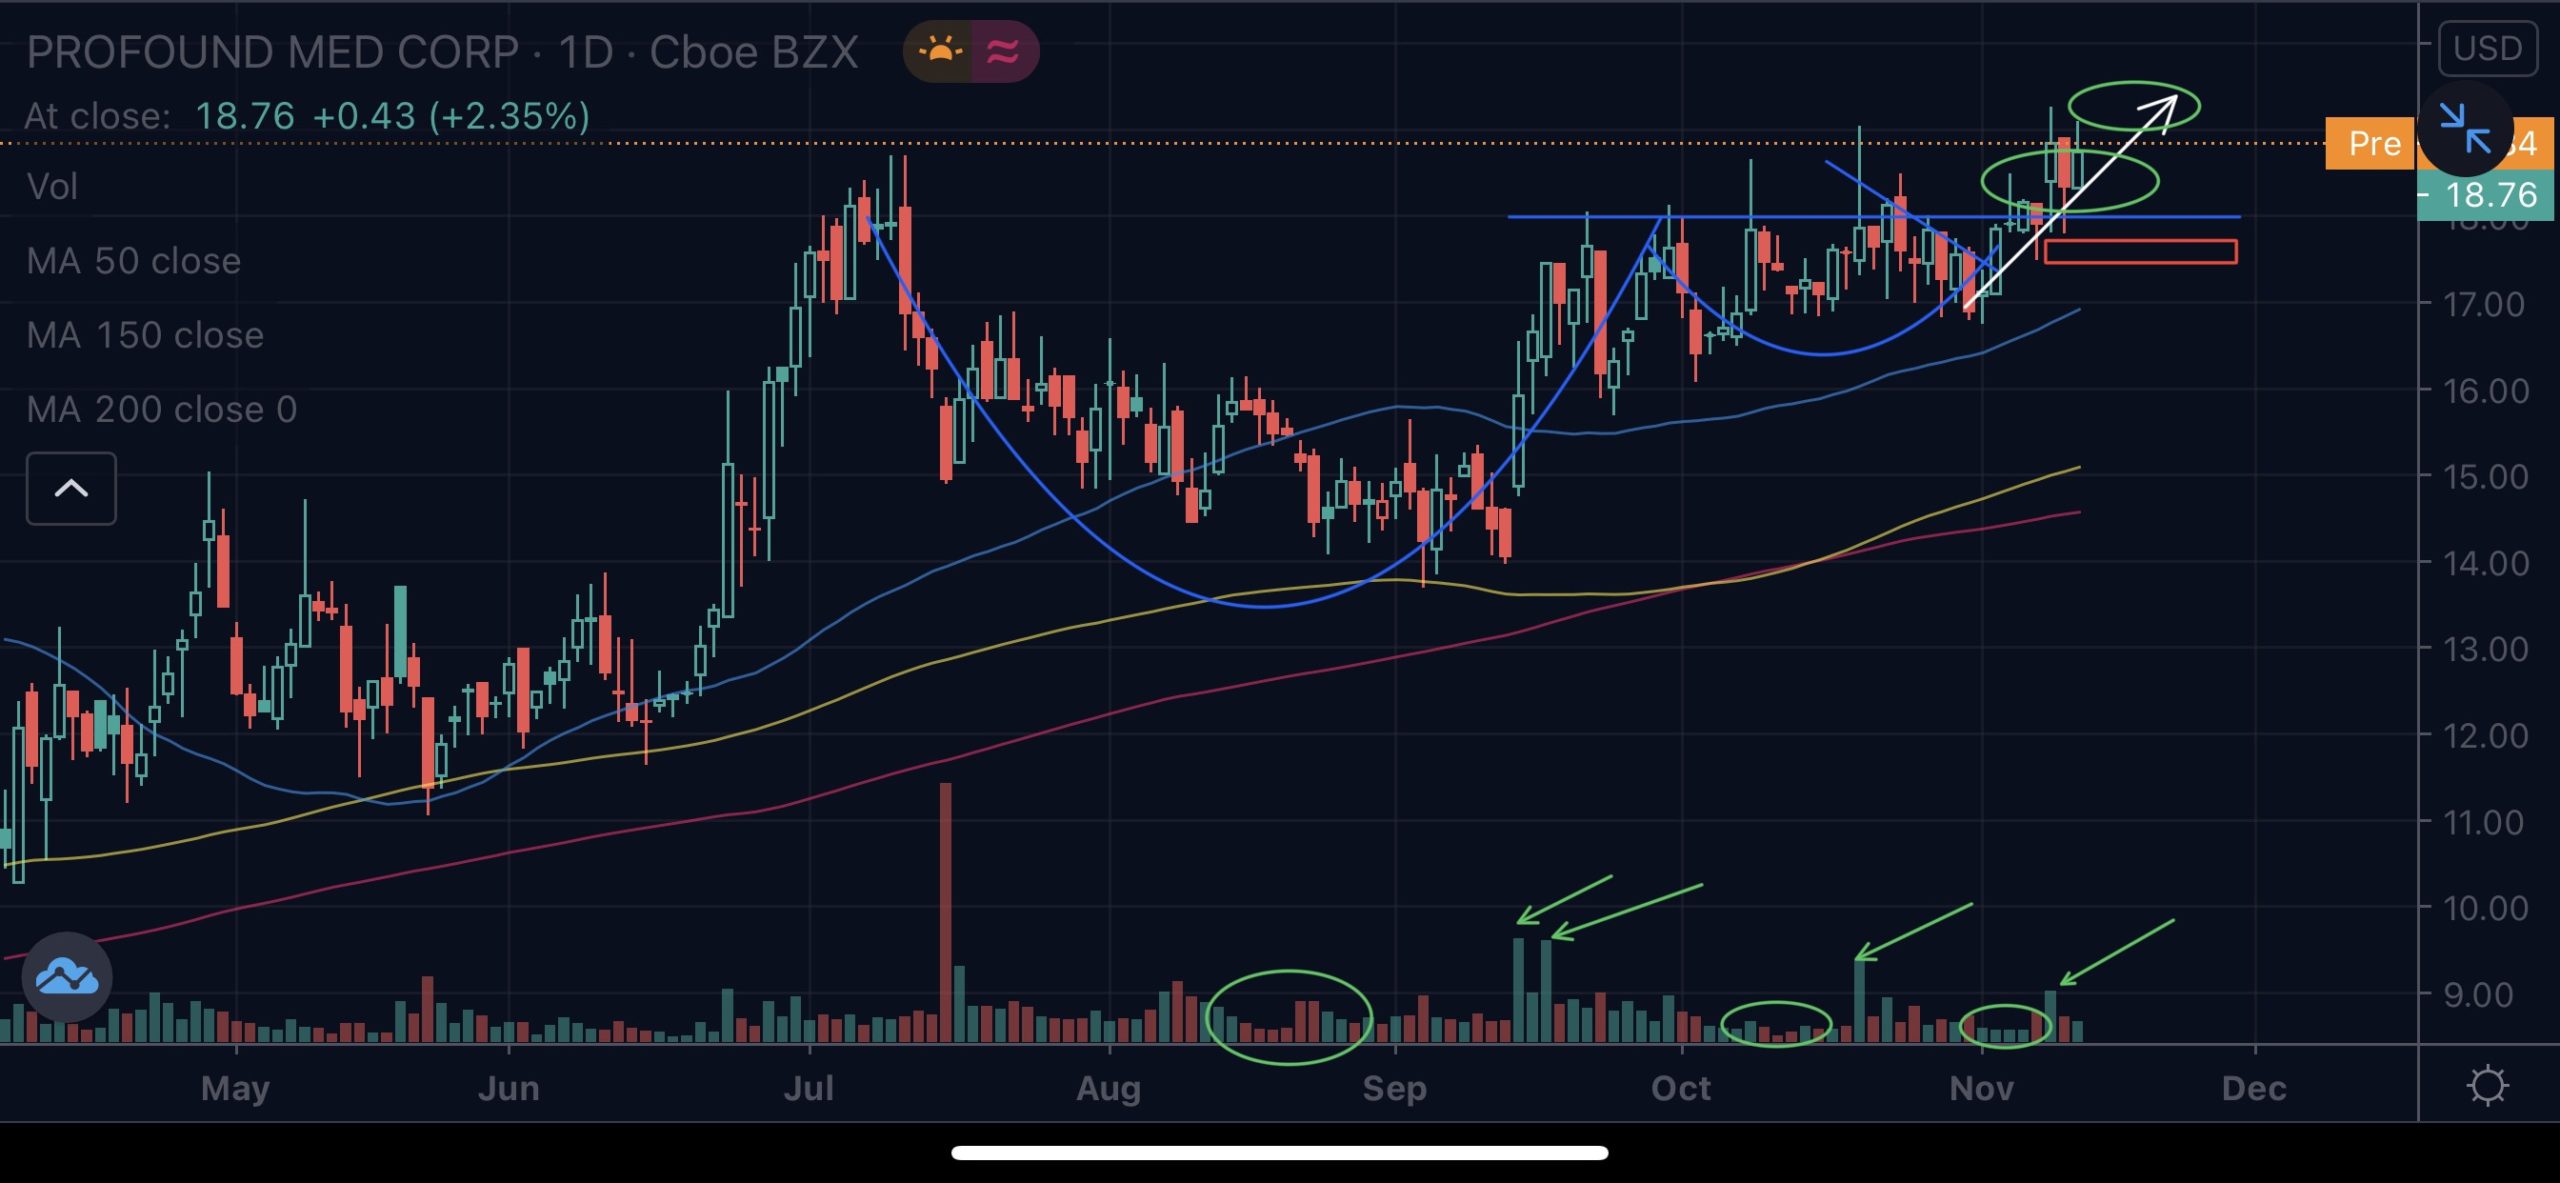
This last stock, $PROF is a good example of a stock I want to really concentrate on for a purchase. We see the same contraction in volatility outlined in blue, two buy points in green, and the green arrows and circles on the volume profile point to high volume on up days, and dried-up volume in the low parts of the volatility contraction pattern. All of this is text book evidence of institutional buying. On top of this technical footprint, see a large increase in earnings in the latest quarter. This could mean the start of an earnings growth story that drives increased attention by institutions and more buying. This is the stock to watch!
Our attention is limited, better to spend it on high probability trades. I like to filter down stocks to only a hand full, and then I want to focus on the one or two that I think will work. Then I take the trade as it moves through the pivot, and size up the next trade if this one works out.
September 22, 2020
by Patrick
Comments Off on QE, Societal Breakdown, and Failed Leadership: Cause and Effect
Listen to any market commentator that is critical of the Federal Reserve, and you will, in time, become aware of the commentator’s belief that all of society’s problems- inequality, rioting in the streets, political discord, etc. are all problems stemming from failed monetary policy.
Market commentators are conflating cause and effect. QE is not the cause of societal breakdown. Rather, QE and the breakdown of our money are the effects of societal breakdown. This breakdown of societal bonds is what always happens in secular society. Always, every time. Same thing happened after the French Revolution when the new zeitgeist of secular society permitted the population to consent to Napoleon’s conquest- and the destruction that ensued across Europe.
The reason a secular society is destined to breakdown lies in the faults inherent in misguided leadership. Misguided leadership due to secularism results from errors of mental models for interpreting reality through a secular world view. Secularism, as a belief system, necessarily requires adherents to build the social structures that form a civilization (governments, laws, economies, cultures, businesses, etc.) in accordance with a subjective morality- the social structures are for the good of the people, but “good” is a subjective ideal. As an extreme example of how this subjectivity can go awry, one can look to the society built by Hitler. He could not have accomplished the scale of destruction he did unless the population did not think, to some extent, he was working for the good of the society.
Men that refuse to acknowledge a Creator, and thus, a morality defined by the Creator— an objective morality— are bound to compounding errors in judgement; for they do not possess and accurate understanding of the base reality in which we are all occupied. The foundations of their thinking are faulty. Higher order thinking therefore, cannot be stable with an unstable foundation. So men who rise to leadership positions in a secular society will naturally possess qualities and thoughts a secular society finds beneficial. Because these qualities of leaders are not formed in accordance with an objective morality, the decisions they make and the social systems built as a result of their decisions will lack the necessary feature of integrity that is for the objective good of the people. As a result of this lack, society as a whole will suffer.
We see the results of failed leadership now- a failed monetary system being perhaps the most prominent. We can see also other stresses that will eventually lead to outright failure in other social systems- our democratic system, healthcare system, education system etc.
The solution for fixing failed social systems will elude us as long as our leaders are lacking the knowledge of our base reality— that there is a Creator and an objective morality.
September 17, 2020
by Patrick
Comments Off on The Bull Case for $TSLA: it’s all one big trade!
September 15, 2020
by Patrick
Comments Off on Fundamental focus
Compare and contrasting two company’s earnings to assess probability of superiority:
$PRLB has been beating estimates by a large margin for the past 3 or 4 quarters, while $AHCO has been missing estimates.
However, $PRLB has not gotten above it’s record earnings, while $AHCO is much newer and therefore, is easily putting out new record earnings.
Both stocks are breaking out of high bases, but we can conclude that analysts have high expectations for $AHCO and relatively lower expectations for $PRLB based on the earnings surprises. So $AHCO is more prone to a sell the news reaction on a run up into earnings, and therefore should be trimmed on a run into earnings, while the odds would favor a gap up on an earnings beat for the next quarter for $PRLB. The estimates for Q4 2020 are at ¢37 right now, which is lower than the previous quarter. So any beat here will signal b an inflection in earnings power.
Both stocks should be on growth watchlists.
$PRLB’s most recent pivot was off its $140 base in late August, while $AHCO broke out from the $20 base in early August 2020.
August 23, 2020
by Patrick
Comments Off on Gold’s thrashing
Gold had two things aligned against in the past two weeks:
1. Munchin pushing for $1T when house Dems were pushing for $2T.
2. Joe Biden’s chief economic advisor in 2014 said “kill king Dollar” in an NYT op-ed. Maybe something Vice President Biden did in the past two weeks lessened his chance of a slam dunk win this November…